K-means
After emailing with Fadi Thabtah, who originally published this dataset. It was determined that we should try to cluster the data to see if we could remove some bias from it. Once we found an optimal cluster, we could then use that grouping to run through the other machine learning models to help increase their performance.
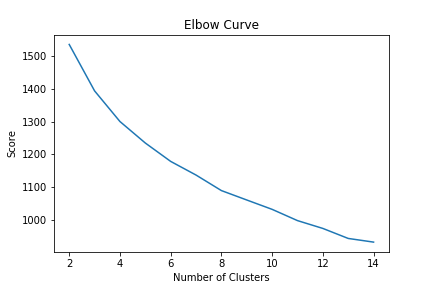
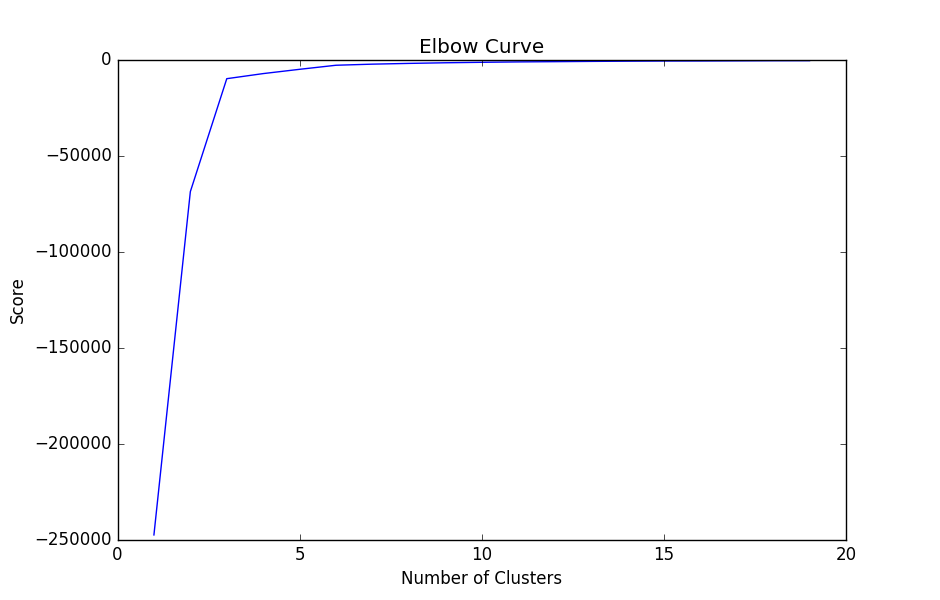
We tested and scored the model on 14 clusters to see which would have the best performance. The first graph below shows what it would look like if there were an optimal cluster for the data. The spot where the graph come to a point indicates the best amount of clusters to use. Our graph doesn't have an elbow so there isn't an optimal cluster to use to help increase performance on our other models.
What our results actually looked like